折线图
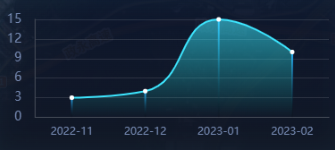
示例一 (单折线)
效果图
参数配置
javascript
const option = {
    grid: {
        top: '15%',
        right: '5%',
        left: "5%",
        bottom: '12%',
        containLabel: true,
    },
    dataZoom: {
        show: true, // 为true 滚动条出现
        realtime: true,
        bottom: "0%",
        startValue: 0, // 从头开始。
        endValue: 3, // 一次性展示6个。
        type: "inside", // 有type这个属性,滚动条在最下面,也可以不行,写y:36,这表示距离顶端36px,一般就是在图上面。
    },
    tooltip: {
        // trigger: 'axis',
        axisPointer: {
            type: 'shadow'
        },
        backgroundColor: 'rgba(9, 24, 48, 0.5)',
        borderColor: 'rgba(75, 253, 238, 0.4)',
        textStyle: {
            color: '#CFE3FC',
        },
        borderWidth: 1,
        confine: true,
    },
    xAxis: {
        data: [],
        axisLine: {
            show: true,
            lineStyle: {
                color: '#474D59',
            }
        },
        axisTick: {
            show: false
        },
        axisLabel: {
            color: '#7589B1',
            fontSize: 12,
            margin: 10
        },
    },
    yAxis: [{
        type: 'value',
        nameTextStyle: {
            color: "#7589B1",
            fontFamily: "Alibaba PuHuiTi",
            fontSize: 14,
            // fontWeight: 600,
            padding: [0, 0, 0, 30],
        },
        // nameGap: 30,  // 表现为上下位置
        splitNumber: 5,
        scale : true,
        min : 0,
        axisLine: {
            show: true,
            lineStyle: {
                color: '#474D59',
            }
        },
        axisTick: {
            show: false
        },
        axisLabel: {
            color: '#7589B1',
            fontSize: 14,
            margin: 15,
            formatter: '{value}',
        },
        splitLine: {
            show: true,
            lineStyle: {
                color: 'rgba(255,255,255,0.12)',
            }
        },
    }],
    series: [
        {
            name: '',
            type: 'bar', // 柱形图
            barWidth: '2',
            itemStyle: {
                // 渐变色
                color: new this.$echarts.graphic.LinearGradient(0, 0, 0, 1, [
                    {
                        offset: 0,
                        color: '#29acff',
                    },

                    {
                        offset: 1,
                        color: 'rgba(0, 0, 0, 0.1)',
                    },
                ]),
                barBorderRadius: 6,
            },
            data: [] // 需要与下方data一致
        },
        {
            name: '规划建设项目',
            type: 'line', // 折线图
            barWidth: '30%',
            symbol: 'circle', // 默认是空心圆(中间是白色的),改成实心圆
            showAllSymbol: true,
            symbolSize: 5,
            smooth: true,
            lineStyle: {
                normal: {
                    color: "#3DE6FF", // 线条颜色
                },
            },
            itemStyle: {
                color: "#fff",
            },
            // 折线下方的区域填充部分
            areaStyle:{
                //线性渐变,前4个参数分别是x0,y0,x2,y2(范围0~1);相当于图形包围盒中的百分比。如果最后一个参数是‘true’,则该四个值是绝对像素位置。
                color: new this.$echarts.graphic.LinearGradient(0, 0, 0, 1, [{
                    offset: 0,
                    color: "rgba(61,230,255,0.8)"
                },
                {
                    offset: 1,
                    color: "rgba(25,255,242, 0)"
                }], false),
            },
            data: []
        }
    ]
}
TIP
动态滚动与柱状图一致,请参考柱状图那边的方法
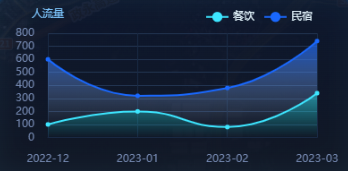
示例二 (双折线)
效果图
配置参数
与 示例一 类似,如果多条折线,就往 series 中加入即可。
这里主要讲一下折线图的圆点颜色。如果 lineStyle 与 itemStyle 是分开写的,则 itemStyle 里的 color,对应圆点的颜色。
否则,如果 lineStyle 是被 itemStyle 包裹着的,则 itemStyle 里的 color 代表着整条线的颜色,所以 lineStyle 直接省略不写。
javascript
const option = {
    ...
    series: [
        // 数据一
        {
            ...
            // 主要看一下这个地方
            lineStyle: {
                normal: {
                    color: "#3DE6FF", // 线条颜色
                    shadowColor: "#3DE6FF", // 线条颜色发光
                    shadowOffsetX: 0,
                    shadowOffsetY: 0,
                    opacity: 1, // 透明度
                    shadowBlur: 18, // 阴影大小
                    type: "solid", // 实线
                },
            },
            itemStyle: {
                color: "#fff",
            },
        },
        // 数据二
        {},
    ]
}