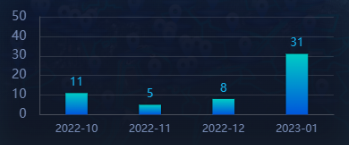
柱状图
示例一
效果图

配置参数
javascript
const option = {
    // 调整图表整体位置
    grid: {
        top: '15%',
        right: '5%',
        left: "5%",
        bottom: '12%',
        containLabel: true, // 防止标签溢出
    },
    // 区域缩放
    dataZoom: {
        show: true, // 为true 滚动条出现
        realtime: true, //拖动时,是否实时更新系列的视图
        bottom: "0%",
        startValue: 0, // 从头开始。
        endValue: 3, // 一次性展示6个。
        type: "inside", // 有type这个属性,滚动条在最下面,也可以不行,写y:36,这表示距离顶端36px,一般就是在图上面。
    },
    tooltip: {
        trigger: 'axis',  // 可选值 'axis' 显示该坐标的所有对比数据 | 'item' 显示选中的单个数据
        axisPointer: {
            type: 'shadow' // 可选值 line 竖线 | cross 交线 | shadow 背景色
        },
        backgroundColor: 'rgba(9, 24, 48, 0.5)',
        borderColor: 'rgba(75, 253, 238, 0.4)',
        textStyle: {
            color: '#CFE3FC',
        },
        borderWidth: 1,
    },
    xAxis: {
        data: [],
        axisLine: {
            symbol: 'arrow', // x轴是否要带箭头,默认 line
            show: true, // 是否显示 x轴线
            lineStyle: {
                color: '#474D59',
            }
        },
        axisTick: {
            show: false // 是否显示刻度线
        },
        axisLabel: {
            color: '#7589B1',
            fontSize: 12,
            margin: 10
        },
    },
    yAxis: [{
        type: 'value',
        nameTextStyle: {
            color: "#7589B1",
            fontFamily: "Alibaba PuHuiTi",
            fontSize: 14,
            padding: [0, 0, 0, 30], // 文字块的内边距
        },
        nameGap: 30,  // 表现为上下位置 坐标轴名称与轴线之间的距离。
        splitNumber: 5, // 坐标轴的分割段数 默认 5
        scale : true,
        max : 50,
        min : 0,
        axisLine: {
            show: true,
            lineStyle: {
                color: '#474D59',
            }
        },
        axisTick: {
            show: false
        },
        axisLabel: {
            color: '#7589B1',
            fontSize: 14,
            margin: 15,
            formatter: '{value}',
        },
        // 坐标轴分隔线
        splitLine: {
            show: true,
            lineStyle: {
                color: 'rgba(255,255,255,0.12)',
            }
        },
    }],
    series: [{
        // name: '采购项目提报',
        type: 'bar',
        barWidth: '30%',
        zlevel: 2,
        itemStyle: {
            // 渐变色
            color: new this.$echarts.graphic.LinearGradient(0, 0, 0, 1, [{
                offset: 0,
                color: '#00CCC5' // 0% 处的颜色
            }, {
                offset: 1,
                color: '#0056DB' // 100% 处的颜色
            }], false),
            shadowColor: 'rgba(0,0,0,0.5)', // 每个柱状图的阴影
            shadowBlur: 3, // 阴影程度
        },
        label: {
            show: true,
            fontSize: 13,
            color: '#14B6F3',
            position: 'top',
        },
        data: []
    }]
}
配置动画效果
让柱状图自行横向滚动
timeOut,默认值为 null
在初始化时,写入以下代码
javascript
...
clearInterval(this.timeOut);
this.timeOut = setInterval(() => {
    if (option.dataZoom.endValue == option.xAxis.data.length) {
        option.dataZoom.endValue = 3;
        option.dataZoom.startValue = 0;
    } else {
        option.dataZoom.endValue = option.dataZoom.endValue + 1;
        option.dataZoom.startValue = option.dataZoom.startValue + 1;
    }
    myEchart.setOption(option);// 渲染页面
}, 1000);