饼图
由于初次使用 echarts ,密密麻麻的配置参数,踩了好多坑,这里对项目中用到的一些配置参数及实现效果,做一个归纳总结
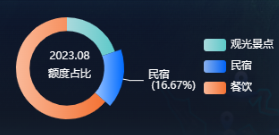
示例一
组成成分
饼图颜色渐变
可以动态循环转动
转动的同时,突出区域,并显示数据
效果图
🏷️ 参数说明
| 属性名称 | 可配置属性 | 描述 |
|---|---|---|
| title | show、text、subtext、x、y、itemGap、textAlign、textStyle、subtextStyle | 标题、副标题、位置及样式配置 |
| tooltip | trigger、formatter | 鼠标移入的提示内容 |
| legend | textStyle、orient、right... | 图例配置,纵向、横向、边距等 |
| series | name、type、radius、center、itemStyle、emphasis、label、data | echarts类型、位置、样式、高亮、标签、数据显示等 |
参数配置
javascript
const option = {
    title : {
        show:true, //默认值true,可选值:true(显示) | false(隐藏)
        text: '2023.08', //主标题文本,'\n'指定换行
        subtext: '额度占比', // 副标题
        x: "49%", // x轴位置
        y: "43%", // y轴位置
        itemGap: 8, // 主副标题间距
        textAlign: 'center',
        textStyle: {
            fontSize: 18,
            fontWeight: '600',
            color: '#000',
        },
        subtextStyle: {
            fontSize: 16,
            fontWeight: '400',
            color: '#000'
        },
    },
    tooltip: {
        trigger: 'item', // 可选值:axis(坐标轴适用 显示单个坐标轴对应的所有数据) | item(显示单块数据)
        formatter: "{b}:{c} <br/> 占比:{d}%"  //a 系列名称,b 数据项名称,c 数值,d 百分比 br换行
        // 写法二 formatter: "{b}总值: {c}" + "\n" + "占比: {d}%"
    },
    legend: {
        textStyle: {
            color: "#000",
        },
        orient: 'vertical', // 可选值:vertical(垂直) | horizontal(水平)
        right: '1%',  //图例距离右的距离
        top: '25%',
    },
    series: [
        {
            name: "额度占比",
            type: "pie",
            radius: ["55%", "75%"], // 通过设置内径与外径将饼图变为圆环饼图
            center: ['50%', '50%'],  // 设置饼状图位置,第一个百分数调水平位置,第二个百分数调垂直位置
            itemStyle: {
                borderRadius: 0, // 设置圆环的圆角弧度
                // 这里设置饼图的渐变色
                color: (list) => {
                    // 注意 !!!!! 这里的数组一定要和实际的类目长度相等或大于,不然会缺少颜色报错
                    var colorList = [
                        {
                            colorStart:'#5CC9C9',
                            colorEnd:'#aad9dc'
                        },
                        {
                            colorStart:'#0062F5',
                            colorEnd:'#8ab1ee'
                        },
                        {
                            colorStart:'#F47233',
                            colorEnd:'#fab999'
                        },
                    ];
                    return new this.$echarts.graphic.LinearGradient(1, 0, 0, 0, [{ //左、下、右、上
                        offset: 0,
                        color: colorList[list.dataIndex]['colorStart']
                    }, {
                        offset: 1,
                        color: colorList[list.dataIndex]['colorEnd']
                    }])
                },
            },
            emphasis: {
                // 设置高亮时显示标签
                label: {
                    show: true,
                },
                labelLine: {
                    show: true,
                    lineStyle: {
                        color: "#000" // 修改引导线的颜色
                    }
                },
                scale: true, // 设置高亮时放大图形
                scaleSize: 7, // 设置放大的倍数
            },
            label: {
                color: "#000",
                // 设置图形标签样式
                show: false, // 未高亮时不显示标签,否则高亮时显示的标签会与静态的标签重叠
                //position: "center",
                // 设置标签展示内容,其中{d}、{b}为echarts标签内容格式器
                formatter(param) {
                    // correct the percentage
                    return param.name + "\n" + ' (' + param.percent + '%)';
                },
            },
            // 数据
            data: [
                {
                    value: 10,
                    name: '观光景点'
                },
                {
                    value: 40,
                    name: '民宿'
                },
                {
                    value: 60,
                    name: '餐饮'
                },
            ],
        },
    ],
};
添加动态循环效果
先添加两个方法,分别控制 高亮 和 取消高亮
关键:dispatchAction()
this.currentIndex,初始值为 -1
this.changePieInterval,初始值为 null
javascript
// 高亮效果切换到下一个图形
selectPie(myEchart,option) {
    var dataLen = option.series[0].data.length;
    this.currentIndex = (this.currentIndex + 1) % dataLen;
    this.highlightPie(myEchart,option);
},
// 取消所有高亮并高亮当前图形
highlightPie(myEchart,option) {
    // 遍历饼图数据,取消所有图形的高亮效果
    for (var idx in option.series[0].data) {
        // 取消高亮
        myEchart.dispatchAction({
            type: "downplay",
            seriesIndex: 0,
            dataIndex: idx,
        });
        // 高亮当前图形
        myEchart.dispatchAction({
            type: "highlight",
            seriesIndex: 0,
            dataIndex: this.currentIndex,
        });
    }
}
在初始化 echarts 和 渲染 option 之间,写入以下代码
javascript
const myEchart = this.$echarts.init(this.$refs.myEchart);// 图标初始化

// 设置自动切换高亮图形的定时器
this.changePieInterval = setInterval(() => this.selectPie(myEchart,option), 1000);

// 鼠标移入到某一图形时,停止自动切换,并高亮鼠标选中的图形
myEchart.on("mouseover", (params) => {
    // 停止循环
    clearInterval(this.changePieInterval);
    // 获取当前选中的块下标
    this.currentIndex = params.dataIndex;
    // 高亮当前图形
    this.highlightPie(myEchart,option);
});

// 鼠标移出时,重新开始自动切换
myEchart.on("mouseout", (params) => {
    if (this.changePieInterval) {
        clearInterval(this.changePieInterval);
    }
    this.changePieInterval = setInterval(() => this.selectPie(myEchart,option), 1000);
});

myEchart.setOption(option);// 渲染页面
示例二
效果图
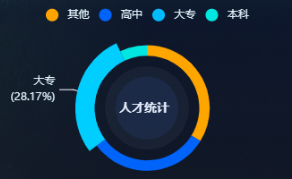
参数配置
图中的三个圆环,分别是在 series 数组中,通过额外加入的 item,去设置圆环的半径,来达到圆环叠加的效果
javascript
const option = {
    color: ["#FFA500", "#0064FB", "#00BCFF", "#00E6E0",],
    title: {
        text: `人才统计`,
        textStyle: {
            fontSize: 18,
            fontWeight: '600',
            color: '#fff',
        },
        x: "41%",
        y: "50%",
    },
    tooltip: {
        trigger: "item",
        formatter: "{b}占比 : {d}%"   //鼠标放上去 展示内容
    },
    legend: {
        icon: "circle", // 图例形状,默认方形
        textStyle: {
            color: "#E6F7FF",
        },
        top: '5%',
    },
    series: [
        {
            name: "人才统计",
            type: "pie",
            radius: ["50%", "60%"],
            center: ["50%", "55%"],
            avoidLabelOverlap: false, // 避免标签重合
            itemStyle: {
                borderColor: "transparent",
            },
            emphasis: {
                // 设置高亮时显示标签
                label: {
                    show: true,
                },
                labelLine: {
                    show: true,
                    lineStyle: {
                        color: "#fff" // 修改引导线的颜色
                    }
                },
                scale: true, // 设置高亮时放大图形
                scaleSize: 10,
            },
            label: {
                // 设置图形标签样式
                show: false, // 未高亮时不显示标签,否则高亮时显示的标签会与静态的标签重叠
                position: "outside", // 标签位置,显示在外侧
                color: "#E6F7FF",
                lineHeight: 18,
                formatter(param) {
                    // correct the percentage
                    return param.name + "\n" + ' (' + param.percent + '%)';
                },
            },
            data: [], // 根据数据替换进去
        },
        {
            name: "阴影圈",
            type: "pie",
            radius: ["0", "40%"],
            center: ["50%", "55%"],
            emphasis: {
                scale: false,
            },
            tooltip: {
                show: false,
            },
            itemStyle: {
                color: "rgba(204,225,255, 0.05)",
            },
            zlevel: 0,
            labelLine: {
                show: false,
            },
            data: [100],
        },
        {
            name: "阴影圈",
            type: "pie",
            radius: ["0", "30%"],
            center: ["50%", "55%"],
            emphasis: {
                scale: false,
            },
            tooltip: {
                show: false,
            },
            itemStyle: {
                color: "rgba(56,119,242, 0.1)",
            },
            zlevel: 0,
            labelLine: {
                show: false,
            },
            data: [100],
        },
    ],
}
TIP
此示例,就只展示参数配置,至于动画效果,直接套用 示例一 的方法即可。
示例三
此示例,通过 示例二 改变了几处参数,并且移出了动画效果
效果图
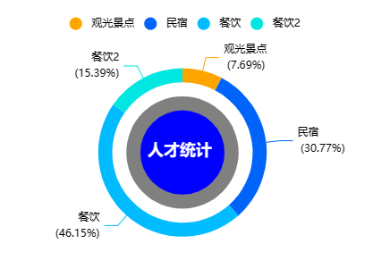
参数配置
javascript
const option = {
    ...
    series: [
        {
            ...
            label: {
                // 设置图形标签样式
                show: true, // 未高亮时不显示标签,否则高亮时显示的标签会与静态的标签重叠
                position: "outside",
                ...
            },
            ...
        },
        ...
    ],
};
示例四
效果图
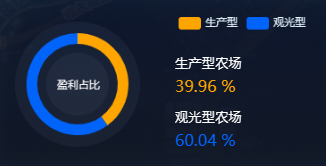
参数配置
javascript
const option = {
    color: ["#FFA500","#0064FB"],
    title : {
        show:true,
        text: '盈利占比', //主标题文本,'\n'指定换行
        x: "24%",
        y: "45%",
        textAlign: 'center',
        textStyle: {
            fontSize: 14,
            fontWeight: '500',
            color: '#fff',
        },
    },
    tooltip: {
        trigger: 'item',
        formatter: "{b}占比 : {d}%"   //鼠标放上去 展示内容
    },
    legend: {
        textStyle: {
            color: "#E6F7FF",
        },
        top: '5%',
        right: '10%'
    },
    series: [
        {
            name: "阴影圈",
            type: "pie",
            radius: ["0", "70%"],
            center: ["25%", "50%"],
            emphasis: {
                scale: false,
            },
            tooltip: {
                show: false,
            },
            itemStyle: {
                color: "rgba(204,225,255, 0.05)",
            },
            zlevel: 0,
            labelLine: {
                show: false,
            },
            data: [100],
        },
        {
            name: "额度占比",
            type: "pie",
            radius: ["45%", "57%"], // 通过设置内径与外径将饼图变为圆环饼图
            center: ['25%', '50%'],  // 设置饼状图位置,第一个百分数调水平位置,第二个百分数调垂直位置
            itemStyle: {
                borderRadius: 0, // 设置圆环的圆角弧度
            },
            zlevel: 1,
            emphasis: {
                // 设置高亮时显示标签
                label: {
                    show: false,
                },
                labelLine: {
                    show: false,
                    lineStyle: {
                        color: "#fff" // 修改引导线的颜色
                    }
                },
                scale: true, // 设置高亮时放大图形
                scaleSize: 7,
            },
            label: {
                color: "#fff",
                // 设置图形标签样式
                show: false, // 未高亮时不显示标签,否则高亮时显示的标签会与静态的标签重叠
                //position: "center",
                // 设置标签展示内容,其中{d}、{b}为echarts标签内容格式器
                formatter(param) {
                    // correct the percentage
                    return param.name + "\n" + ' (' + param.percent + '%)';
                },
            },
            data: [
                { value: 6088.4, name: "生产型" },
                { value: 9148.2, name: "观光型" },
            ],
        },
        {
            name: "阴影圈",
            type: "pie",
            radius: ["0", "35%"],
            center: ["25%", "50%"],
            emphasis: {
                scale: false,
            },
            tooltip: {
                show: false,
            },
            itemStyle: {
                color: "rgba(204,225,255, 0.05)",
            },
            zlevel: 0,
            labelLine: {
                show: false,
            },
            data: [100],
        },
    ],
}
计算总量 & 百分比
javascript
countPieData() {
    let count = 0;
    // 统计
    this.pieData.forEach(item => {
        count = count + item.value;
    })
    this.totalCount = count;
}
html
<div class="pecent_data_item" v-for="(item,index) in pieData" :key="index">
    <div class="title">{{item.name}}</div>
    <div class="pecent" :style="{'color': `${item.color}`}">{{((item.value / totalCount) * 100).toFixed(2) + " %"}}</div>
</div>
示例五
效果图
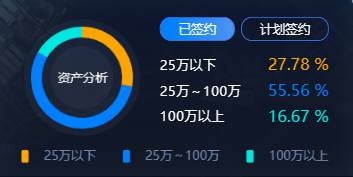
参数配置
与 示例四 相似,主要写一下,图例的相关样式
右侧的数据是直接div写上去的,非 echarts 生成
javascript
const option = {
    ...
    legend: {
        x: 'center',
        orient: 'horizontal', // 水平显示
        textStyle: {
            color: "#7589B1",
            fontSize: 14,
            padding: 12 // 图例形状与文字直接的间距
        },
        bottom: '5%',
        itemGap: 30, // 每一个图例的间距
        itemWidth: 8,  // 图例左侧形状大小
        itemHeight: 14,  // 图例左侧形状大小
    },
    ...
}